>

HRAMS

High Resolution Aerial Monitoring System

By analysing the orthophotos taken at an annual or more frequent rate, with a range of 0,5-5cm spatial resolution and the 3D surface models of aerial surveys, the possibility will be open to map the vegetation of the upper canopies on species level. Further on, it will be possible to follow up the changes at forest edges and inside the forest and meadows the upper canopy-level- and grass-dynamics in a more accurate and productive way than with any other working procedure on this scale ever before. During the fieldwork analyses, the vectorgraphic spatial data obtained from aerial surveys can be filled with information from a number of research fields. A survey carried out in the accurate moment contributes to the baseline reports of interventions and the control of the rehabilitation and environmental reconstruction.

Forest reserve 3 cm
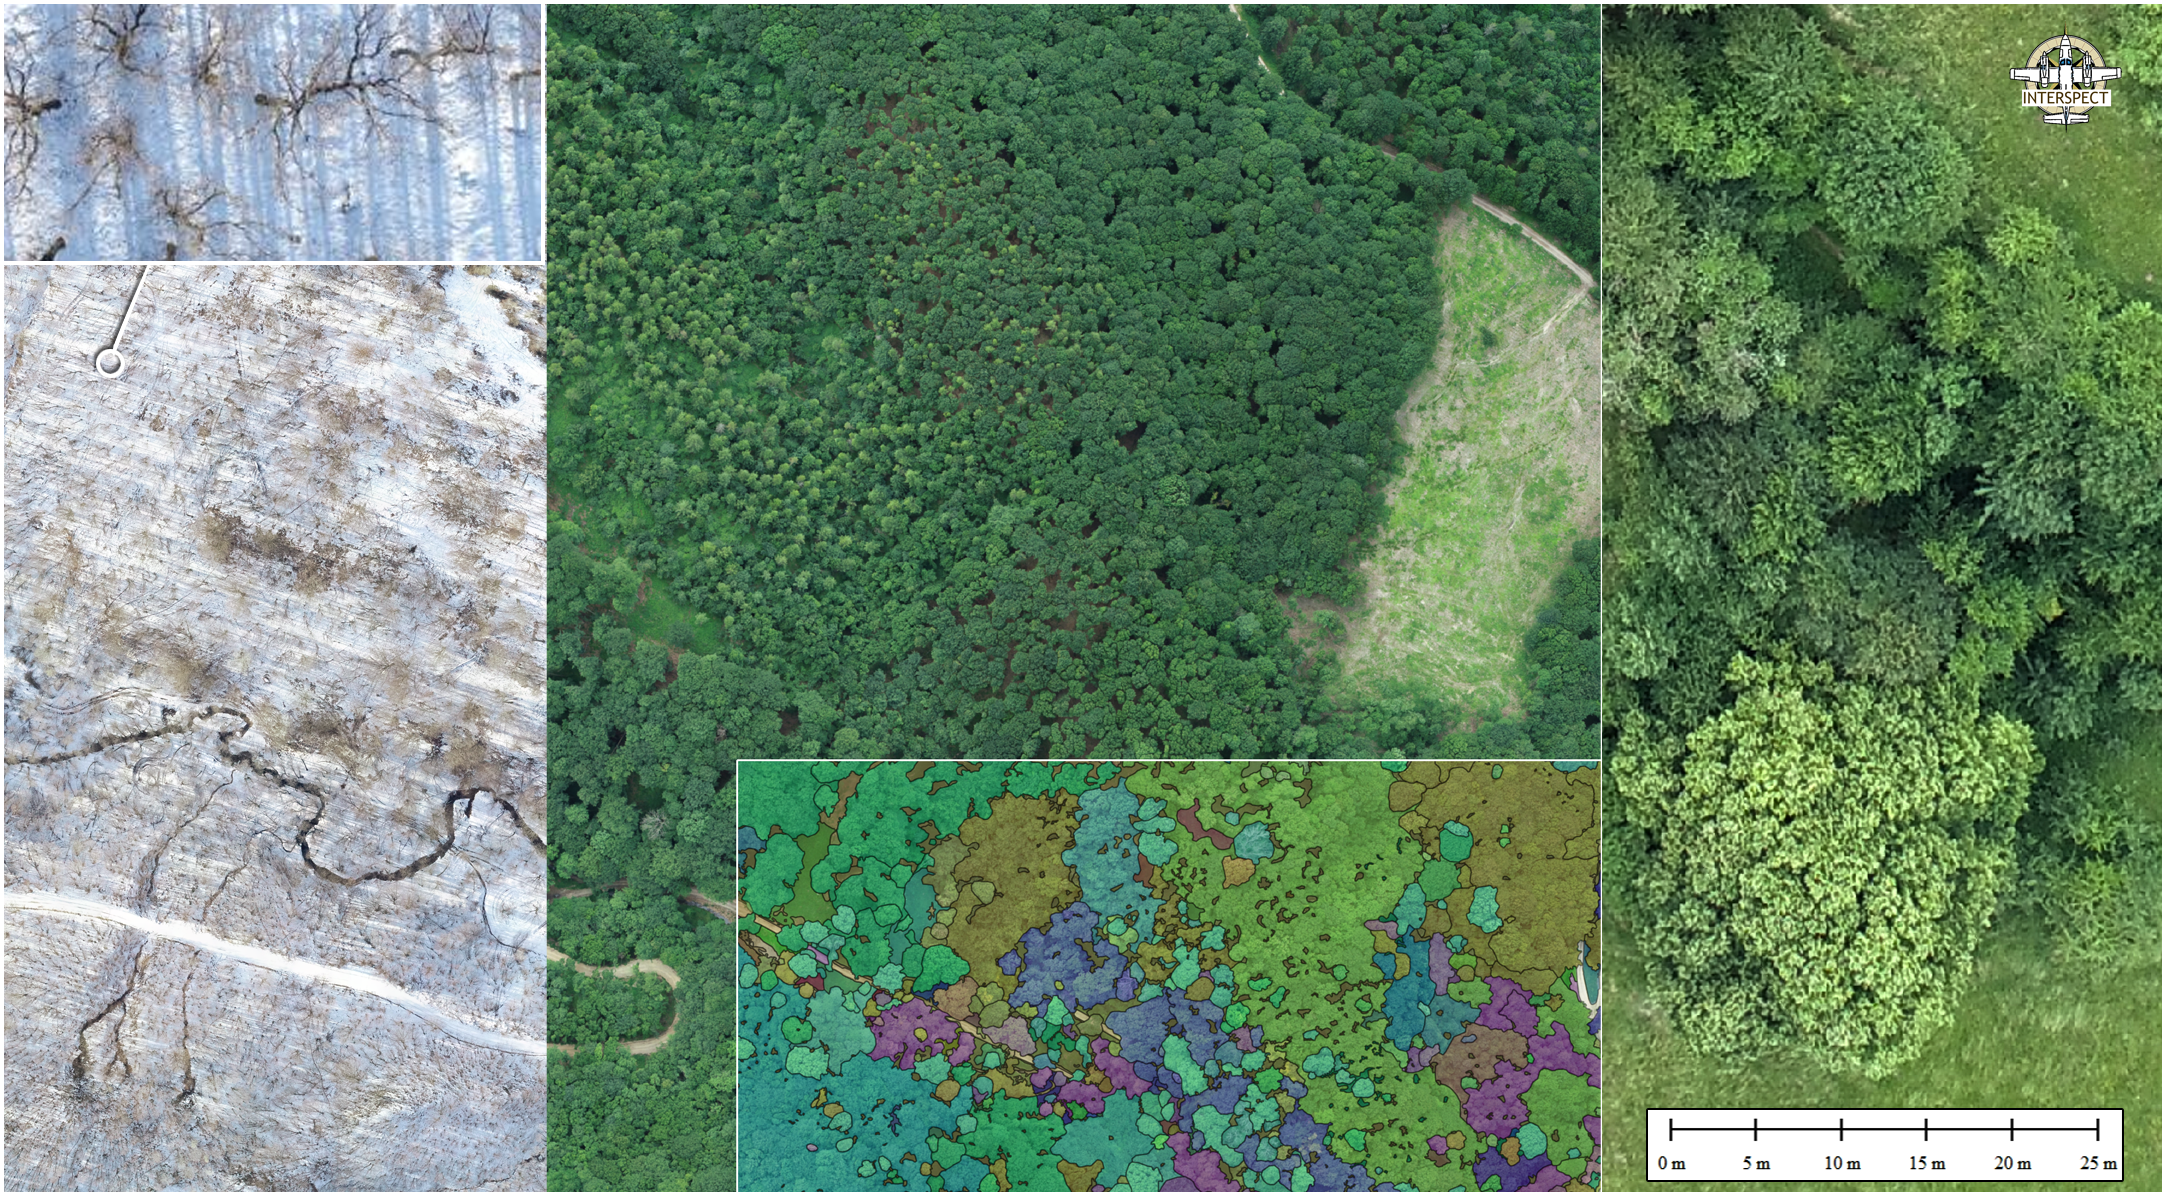
Winter and summer aspects of Submontane forest and the detail of the spatial database
Time series of large areas with an accuracy range of decimetres (Detail of the Bakonybél sample area)


HRAMS Key principles

  • Statistically comparable spatial databases: land cover, land use, habitat, soil conditions, hydrology-, forestry-, microclimate-, risk data, the consistent database of landscape value registry
  • Opportunity for Big data analysis: A data structure that is readable by artificial intelligence
  • Methods without disturbance: the aerial survey can’t cause any perceivable disturbance on the assessed habitats. A large number of survey cycles cannot endanger the birds and flying mammals present. Therefore we developed an equipment and procedure base that allows us to take precise orthophotos with extremely high spatial resolution from an altitude of 800m or higher (Bakó 2013; Bakó 2013b; Bakó et al. 2014; Bakó 2017).
  • Open source: Free access and publishing
  • Reinforcing feedback
  • Sampling of landscape details: The answers on the climate change and specific impacts can be modelled with the representative network of characteristic landscape details.
  • Network for validating satellite images: with the help of the large spatial resolution time series, we can access the patchs orthogonal view with a spatial resolution of cm even when the satellite image was taken years ago and otherwise we wouldn’t be able to read the signals on the archive satellite images. The network covering multiple countries landscapes is built of independent, approximately 1 square km sample areas.
  • Supports spatial planning: by detecting and understanding the anomalies, it will be possible to model the reactions of alive and dead elements to the expected changes in a given area.
  • It's important to provide information that can be extrapolated to whole landscape details and serves as data to ecosystem databases with complete national and continental coverage. Therefore the data collection- and storage structures have conformity with the international data models.


  • Categories of the plots

    I. Waterbird nesting areas (flown three times per year) ;
    II. Representative sample area of the landscape with optional orientation (areas flown 1-4 times per year);
    III. Representative sample area of the landscape with optional orientation and aspect ratio (areas flown 1-5 times per year)

    (Spatial resolution of the orthophoto, economic sample area size, root-mean-square error (RMS), digital substance and area of use)

     Category

     I.

     II.

     III.

     Spatial resolution  0,5 cm  2 cm  4 cm
     Area size  Depending on the nesting sites size  200 × 300 m  1000 × 2000 m
     Planimetric accuracy  20 cm  20 cm  20 cm
     Products  Orthophotos with full area coverage  Orthophotos with full area coverage, oblique photogrammetric products and three-dimensional models  Orthophotos with full area coverage, oblique photogrammetric products and three-dimensional models
     Flight time above area
     2 - 10 min. (Depending on area size)  ~ 3 min.  5 - 12 min.

    3D DFM
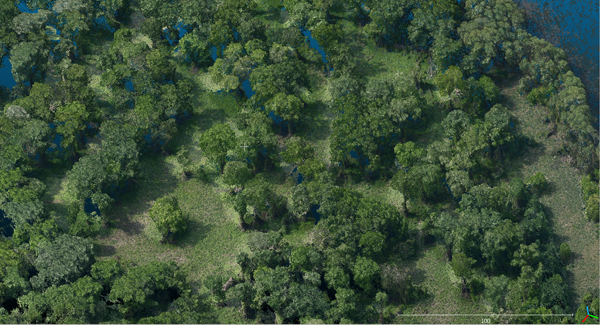
    Beside 0,5- 5 cm field resolution orthophotos, the coloured 3d spatial models of the plots are also available.
    (Detail area of the Háros-peninsula Forest Reserve)

    3D DFM
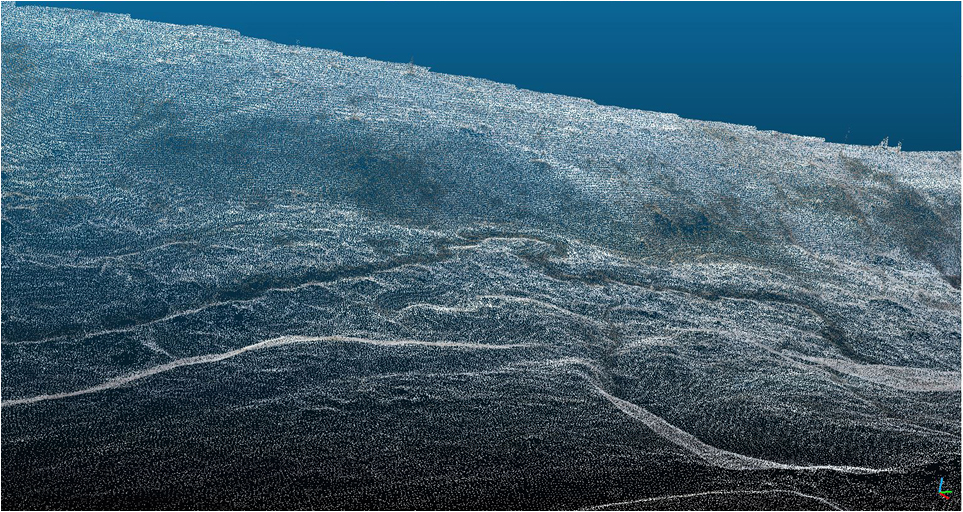
    From the winter photogrammetric survey, a large resolution terrain model can be derived
    (Detail of the Bakonybél sample area)

    Active areas of the network

    Aktív mintaterületek 2019-ben
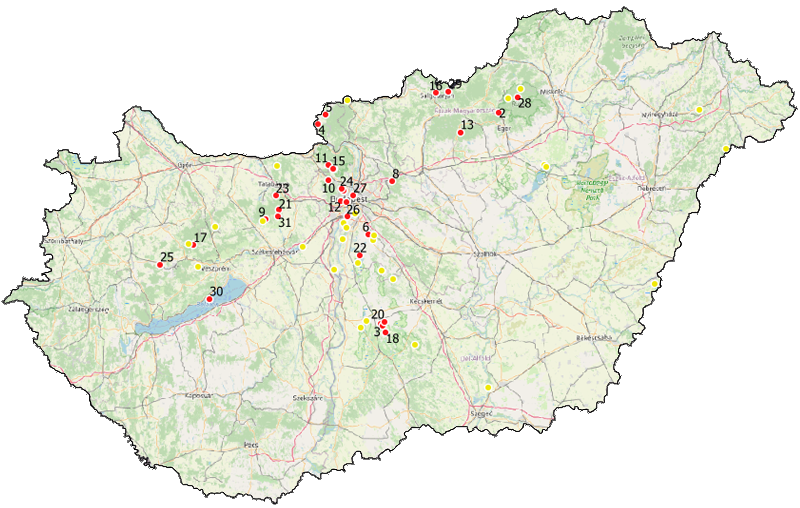
    Experimental areas of the network 2018-2019

    1. Háros-félsziget Forest reserve
    2. Szarvaskő Grasslands
    3. Soltszentimrei borókás Ancient juniper site
    4. Cserge-patak Beaver study area
    5. Orzsán-patak Beaver study area
    6. Ócsai lápvidék Wetland habitat
    7. Kolon-tavi erdőrestaurációs kísérlet Softwood forest restoration
    8. Nagy Istrázsa-hegy Forest reserve Forest Reserve Valkó - Gödöllő
    9. Juhdöglő-völgy Forest reserve Forest reserve
    10. Kisszénás Grasslands
    11. Pilistető Forestry area
    12. Csillebérc Deforestation
    13. Kékes-tető Forest reserve Forest reserve
    14. Pilis lék kísérleti terület Experimental forest management area
    15. Piliskísérlet Experimental forest management area
    16. Baglyaskővár Cultural history area
    17. Bakonybél Forestry area
    18. Közös Erdő Bioszféra Rezervátum. Forest reserve
    19. Hármashatár-hegy Degraded forest
    20. Kolon-tavi gémtelepek Heron Colony as an Ecosystem Indicator
    21. Pamlag-völgy (Vértes-hg) Forests and grasslands
    22. Apaj Lawns
    23. Vitányvár-völgye Forest
    24. Vöröskő vár Coluber caspius habitat
    25. Devecser Environmental restoration site

    From the workflow

    We combine areal remote sensing and field studies in our survey. The parameters are measured with the interpretation of the 2-5 cm field resolution orthophotos and the field survey. In some cases, the process can be accelerated by semi-automatic classification. In other cases manual delimitation and identification are necessary. This mainly depends on the interdependence of the vegetation, the species and the condition of the production area.
    The individual attribute columns of the polygons of the gap- and overlap-free vector-graphics polygon network are generated on the orthophoto with full area coverage. During the fieldwork, these will be filled with additional data by the experts. The field survey – as data collection and later, as control phase – is realized in all cases except the nesting areas where the heron species are analysed from orthophotos with 0,5 cm detail that was taken without disturbance.

    Ecosystem service mapping

    Supporting services

  • Nutrient cycling

  • Primary production

  • Soil formation

  • Habitat provision

  • Water purification

  • ...

  • Provisioning services

  • Food, crops, wild foods, and spices, raw materials

  • Genetic resources

  • Water purity

  • Biogenic minerals

  • Medicinal resources

  • Energy

  • Ornamental resources

  • ...

  • Regulating services

  • Carbon sequestration

  • Climate regulation

  • Predation regulates prey populations

  • Waste decomposition and detoxification

  • Purification of water and air

  • Pest and disease control

  • ...